Dec 2, 2025
Spot Winners with the Piotroski Score: This Week’s Standout Stocks
Ever look at your portfolio and think, “I just want to know which companies are actually getting stronger?”
As an investor, you want miracle stocks. We all do.
But would you settle for an easy way to find healthier, more profitable companies – a way that could give you a 23 percentage point advantage, per academic research?
Of course you would.
That’s what the Piotroski F-Score provides. It’s a nine-question, accounting-based checklist that shows whether a company is getting stronger or weaker. It’s clean, mechanical, and historically effective in value-focused markets.
What Exactly Is the Piotroski Score?
The Piotroski Score was developed by Stanford accounting professor Joseph Piotroski, who discovered that a simple, nine-point checklist could dramatically improve stock-picking results.
In his original research, buying high-scoring companies (8s and 9s on a scale of 0-9) produced 23% annual returns from 1976–1996 — meaning companies with improving financial health consistently outperformed.
It is a 0–9 point system, based on nine yes-or-no questions grouped into three categories:
Profitability (4 checks): Piotroski wants companies that make money, collect cash, and are doing better than last year.
Is cash flow higher than net income? (Means the profits are real, not “paper profits.”)
Did profits improve compared to last year? (ROA higher year-over-year = the business is getting more profitable.)
Is cash actually coming in the door? (Operating cash flow positive = real cash, not just accounting profit.)
Is the company earning a profit? (ROA positive = the business isn’t losing money.)
Leverage, Liquidity & Dilution (3 checks):Piotroski wants companies that are reducing debt, staying financially healthy, and not diluting shareholders.
Did they avoid issuing new shares?
Is the company’s ability to pay its bills improving? (Current ratio improving = more short-term financial breathing room.)
Is long-term debt going down? (Less debt = lower risk.)
Operating Efficiency (2 checks):Piotroski wants companies that are getting more efficient — spending less, earning more, and doing more with what they already own.
Are they generating more revenue from the assets they already have? (Asset turnover is improving.)
Are they making more profit on each dollar of sales? (Gross margin improving.)
How You Can Use the Piotroski Score
The Piotroski Score gives you something simple, rules-based way to spot financial health and improvement.
0–2 = Weak: Often companies deteriorate financially.
3–5 = Neutral: Some strengths, some weaknesses.
6–7 = Mixed but good: Often reliable, but worth deeper evaluation.
8–9 = Strong improvement: Potential research candidates.
This Week’s Piotroski Standouts
(Based on SEC financials — not screening tools)
Here are the most interesting names from our strict Piotroski work this week. Each one is based on the latest actual 10-Q data, not automated screeners.
1. Lifeway Foods (LWAY) — Piotroski Score: 8 / 9
Quarter: Q2 2025 (For the quarterly period ended: June 30, 2025)
Industry: Cultured Dairy & Probiotics
Lifeway delivered a well-rounded quarter, with improvements in profitability, liquidity, and efficiency. Lifeway Foods earns an 8 out of 9.
Piotroski Score Details:
Profitability (3 / 4):
✔ ROA is positive
Net income: $4,249K
Total assets: $98,267K
ROA: 4.32%
✔ Operating cash flow is positive
Year-to-date operating cash flow: $3,762K
CFO > 0
✔ ROA improved year-over-year
2025 Q2 ROA: 4.32%
2024 Q2 ROA: 4.18%
ROA increased from 4.18% to 4.32%
❌ CFO did not exceed net income
YTD CFO: $3,762K
YTD net income: $7,789K
CFO < Net Income: Fails under Piotroski rules
Profitability subtotal: 3 / 4
Leverage & Liquidity (3 / 3):
✔ Leverage decreased
2024 included term loan debt
2025: $0 debt outstanding
✔ Current ratio improved
2025 Q2: 3.03
2024 Q2: 2.81
Liquidity rose from 2.81 to 3.03
✔ No share dilution
All share count changes were from stock-based compensation
No new shares issued for cash
Leverage & Liquidity subtotal: 3 / 3
Operating Efficiency (2 / 2):
✔ Gross margin improved
2025 Q2: 28.6%
2024 Q2: 27.0%
Gross Margin increased from 27.0% to 28.6%
✔ Asset turnover improved
2025: 0.548
2024: 0.543
Asset turnover strengthened from 0.543 to 0.548
Efficiency subtotal: 2 / 2
Piotroski Summary — Lifeway Foods (Q2 2025):
Bottom Line:
Lifeway’s financial picture this quarter is solid. Profitability is improving, margins are widening, and operations are becoming more efficient. Just as importantly, the company has no debt and maintains a healthy liquidity cushion — a reassuring position in any market environment.
Shareholders also benefit from the lack of dilution, as Lifeway did not issue new equity. The only softer point in the score is that cash flow hasn’t yet exceeded net income for the year, but overall, the company’s fundamentals have moved meaningfully in the right direction.
For investors who favor companies with strengthening balance sheets and improving operational quality, Lifeway presents a steady, grounded story of financial progress worth keeping on the radar.
2. Sturm Ruger (RGR) — Piotroski Score: 8 / 9
Quarter: Q1 2025 (For the quarterly period ended March 29, 2025 )
Industry: Firearms Manufacturing
Sturm Ruger delivered a clean and disciplined first quarter. Profitability improved year over year, margins strengthened, cash flow remained positive, and the balance sheet stayed debt-free. Ruger earns a strong 8 out of 9.
Piotroski Score Details:
Profitability (4 / 4)
✔ ROA is positive
Net income: $7,768K
Total assets: $379,003K
ROA: 2.05%
✔ Operating cash flow is positive
Cash flow from operations: $11,145K
CFO > 0
✔ ROA improved year-over-year
2025 Q1 ROA: 2.05%
2024 Q1 ROA: 1.84%
ROA increased from 1.84% to 2.05%
✔ CFO exceeded net income
CFO: $11,145K
Net income: $7,768K
CFO > NI: 11,145 > 7,768
Profitability subtotal: 4 / 4
Leverage & Liquidity (2 / 3)
✔ Leverage did not increase
RGR has zero long-term debt in both 2024 and 2025.
No new borrowings → Leverage did not rise
❌ Current ratio decreased
2025 Q1: 4.63
2024 Q1: 5.16
Liquidity decreased from 5.16 to 4.63
✔ No share dilution
Basic shares outstanding:
2024 Q1: 17,434,178
2025 Q1: 16,623,214
Share count declined due to repurchases; no new shares issued for cash.
Leverage & Liquidity subtotal: 2 / 3
Operating Efficiency (2 / 2)
✔ Gross margin improved
2025 Q1:22.0%
2024 Q1:21.5%
Gross margin increased from 21.5% to 22.0%
✔ Asset turnover improved
2025: 0.358
2024: 0.356
Turnover improved from 0.356 to 0.358
Efficiency subtotal: 2 / 2
Piotroski Summary — Ruger (Q1 2025)
Bottom Line
Ruger’s financial footing this quarter is strong and steady. The company continues to do the things most investors appreciate: it earns consistent profits, converts those profits into cash, and operates with no debt. Margins and asset efficiency both improved year-over-year, reflecting a business that is running slightly better than it was a year ago.
Shareholders also benefit from the company’s ongoing buybacks, which reduce the share count without taking on debt or issuing new stock. The only deduction comes from a stricter liquidity comparison, not from any deterioration in core business strength.
Overall, Ruger presents as a financially conservative, steadily-operated manufacturer with clean accounting, strong cash generation, and a balance sheet most companies would envy. For investors who value stability and operational clarity, Ruger remains a compelling company to monitor.
3. The Buckle, Inc. (BKE) — Piotroski Score: 8 / 9
Quarter: Q2 2025 (For the Quarterly Period Ended August 2, 2025)
Industry: Specialty Apparel Retail
Buckle delivered another financially disciplined quarter. Profitability remained strong, liquidity improved, and the company continued operating with a debt-free balance sheet. Buckle earns a very strong 8 out of 9.
Only one criterion (Asset Turnover) does not pass this period.
Piotroski Score Details
Profitability (4 / 4)
✔ ROA is positive
Net income (Q2 2025): $45,006K
Total assets: $1,028,632K
ROA: 4.38%
✔ Operating cash flow is positive
YTD CFO (26 weeks): $89,412K
✔ ROA improved year-over-year
2025 Q2 ROA: 4.38%
2024 Q2 ROA: 4.30%
ROA increased from 4.30% to 4.38%
✔ CFO > Net Income
YTD CFO: $89,412K
YTD net income: $80,199K
CFO > NI → strong earnings quality
Profitability subtotal: 4 / 4
Leverage & Liquidity (3 / 3)
✔ Leverage did not increase (debt-free both years)
BKE has zero long-term debt in both Q2 2024 and Q2 2025.
Leverage stayed at 0
✔ Current ratio improved year-over-year
2025 Q2:
Current assets: $493,302K
Current liabilities: $229,554K
CR:2.15
2024 Q2:
Current assets: $439,209K
Current liabilities: $213,932K
CR: 2.05
Current ratio improved from 2.05 to 2.15
✔ No share dilution
Changes in share count came only from restricted stock vesting (compensation)
No shares issued for cash
Leverage & Liquidity subtotal: 3 / 3
Operating Efficiency (1 / 2)
✔ Gross margin improved
2025 Q2: 47.4%
2024 Q2: 46.9%
GM increased from 46.9% to 47.4%
❌ Asset turnover did not improve
2025 Q2:0.2974
2024 Q2:0.3003
Turnover fell slightly from 0.3003 to 0.2974
Efficiency subtotal: 1 / 2
Piotroski Summary — Buckle (Q2 2025)
Bottom Line
Buckle’s financial footing remains strong. The company continues to operate without debt, maintains a healthy liquidity position, and produces consistent profitability backed by solid cash flow. Gross margins improved year-over-year, and earnings quality remains high.
The only item that didn’t pass this quarter is asset turnover, which dipped slightly compared to last year. This does not signal financial weakness; it simply reflects that revenue did not grow as fast as total assets over the period — a normal dynamic for a seasonal retailer like Buckle.
For investors seeking stable, well-managed businesses with solid fundamentals, Buckle remains a financially clean operator delivering steady performance and shareholder-friendly capital discipline.
4. Build-A-Bear Workshop (BBW) — Piotroski Score: 8 / 9
Quarter: Q2 2025 ( For the quarterly period ended August 2, 2025 )
Industry: Specialty Retail / Experiential Consumer Products
Build-A-Bear posted a strong quarter across nearly every financial category. Profitability improved, cash flow remained robust, liquidity strengthened, and the company continues to operate without debt. Under the strict, year-over-year Piotroski scoring framework — which evaluates nine objective measures of financial health — Build-A-Bear earns an 8 out of 9.
The only item that did not pass is asset turnover, which slipped slightly year over year. Everything else: solid.
Piotroski Score Details
Profitability (4 / 4)
✔ ROA is positive
Net income: $12,367K
Total assets: $318,238K
ROA: 3.9%
✔ Operating cash flow is positive
YTD operating cash flow: $32,017K
CFO > 0
✔ ROA improved year-over-year
2025 Q2 ROA: 3.9%
2024 Q2 ROA: 3.1%
ROA increased from 3.1% to 3.9%
✔ CFO > Net Income
CFO: $32,017K
YTD Net Income: $27,686K
CFO > NI: strong earnings quality
Profitability subtotal: 4 / 4
Leverage & Liquidity (3 / 3)
✔ Leverage did not increase (no debt)
BBW carries no interest-bearing debt in either year.
Leverage did not rise
✔ Current ratio improved year-over-year
2025 Q2:1.78
2024 Q2:1.46
Liquidity improved from 1.46 to 1.78.
✔ No share dilution
Shares outstanding decreased:
2024: 13,590,945
2025: 13,159,408
Net share count declined
Leverage & Liquidity subtotal: 3 / 3
Operating Efficiency (1 / 2)
✔ Gross margin improved
2025 Q2: 57.6%
2024 Q2: 54.2%
Gross margin improved by 340 basis points.
❌ Asset turnover did not improve
2025 Q2: 0.390
2024 Q2: 0.400
Slight decline from 0.400 to 0.390
Efficiency subtotal: 1 / 2
Piotroski Summary — Build-A-Bear (Q2 2025)
Bottom Line
Build-A-Bear’s financial profile this quarter is strong and well-balanced. The company continues to generate solid profits, strong operating cash flow, and higher liquidity while maintaining a debt-free balance sheet. Revenue grew year over year, gross margins expanded, and the business continued to reduce its share count — a sign of disciplined capital management.
The only element that held Build-A-Bear back from a perfect score was a slight dip in asset turnover, which reflects revenue not increasing quite as fast as the asset base. This is not a red flag — just a mechanical deduction in the Piotroski framework.
Overall, Build-A-Bear demonstrates the type of steady operational execution and financial discipline that many fundamentals-driven investors appreciate: clean accounting, improving profitability, and a conservative balance sheet.
5. Dynavax Technologies (DVAX) — Piotroski Score: 7 / 9
Quarter: Q3 2025 (For the quarterly period ended September 30, 2025)Industry: Biopharmaceuticals / Vaccines
Dynavax posted a solid quarter with stronger profitability, improving operating efficiency, and continued balance-sheet strengthening through large net share reductions. Dynavax earns a fairly strong 7 out of 9.
The company comes up short on leverage and liquidity tests, but otherwise demonstrates clear year-over-year improvement across profitability, cash flow, margins, and operational efficiency.
Piotroski Score Details
Profitability (4 / 4)
✔ ROA is positive
Net income: $26,927K
Total assets: $946,506K
ROA: 2.8%
✔ Operating cash flow is positive
Year-to-date operating cash flow: $37,621K
CFO > 0
✔ ROA improved year-over-year
2025 Q3 ROA: 2.8%
2024 Q3 ROA: 1.7%
ROA increased from 1.7% → 2.8%
✔ CFO > Net Income (YTD)
CFO YTD: $37,621K
Net Income YTD: –$50,451K
CFO > NI, strong cash-backed earnings quality
Profitability subtotal: 4 / 4
Leverage & Liquidity (1 / 3)
❌ Leverage did not decrease
Long-term debt ratio increased year over year:
2024 Q3: 21.0%
2025 Q3: 23.3%
Leverage worsened YoY.
❌ Current ratio did not improve
2025 Q3: 7.62
2024 Q3: 13.23
Liquidity weakened.
✔ No share dilution
Shares outstanding decreased via aggressive repurchase activity:
2024 Q3: 131,345,000
2025 Q3: 117,364,000
Net share count declined.
Leverage & Liquidity subtotal: 1 / 3
Operating Efficiency (2 / 2)
✔ Gross margin improved
2025 Q3: 84.8%
2024 Q3: 83.8%
Gross margin expanded YoY.
✔ Asset turnover improved
2025 Q3 AT: 0.10
2024 Q3 AT: 0.076
Operational efficiency improved meaningfully.
Efficiency subtotal: 2 / 2
Piotroski Summary — Dynavax (Q3 2025)
Bottom Line
Dynavax continues to strengthen its financial performance, posting higher profitability and cash flow while improving both gross margin and asset efficiency. The company also meaningfully reduced its share count, which supports shareholder value. Leverage and liquidity metrics weakened year-over-year, which held Dynavax back from a higher Piotroski score, but the underlying operational trend remains favorable.
For investors who value improving fundamentals, expanding margins, and strong cash generation — especially in small- to mid-cap biotech — Dynavax presents a compelling financial profile with clear momentum.
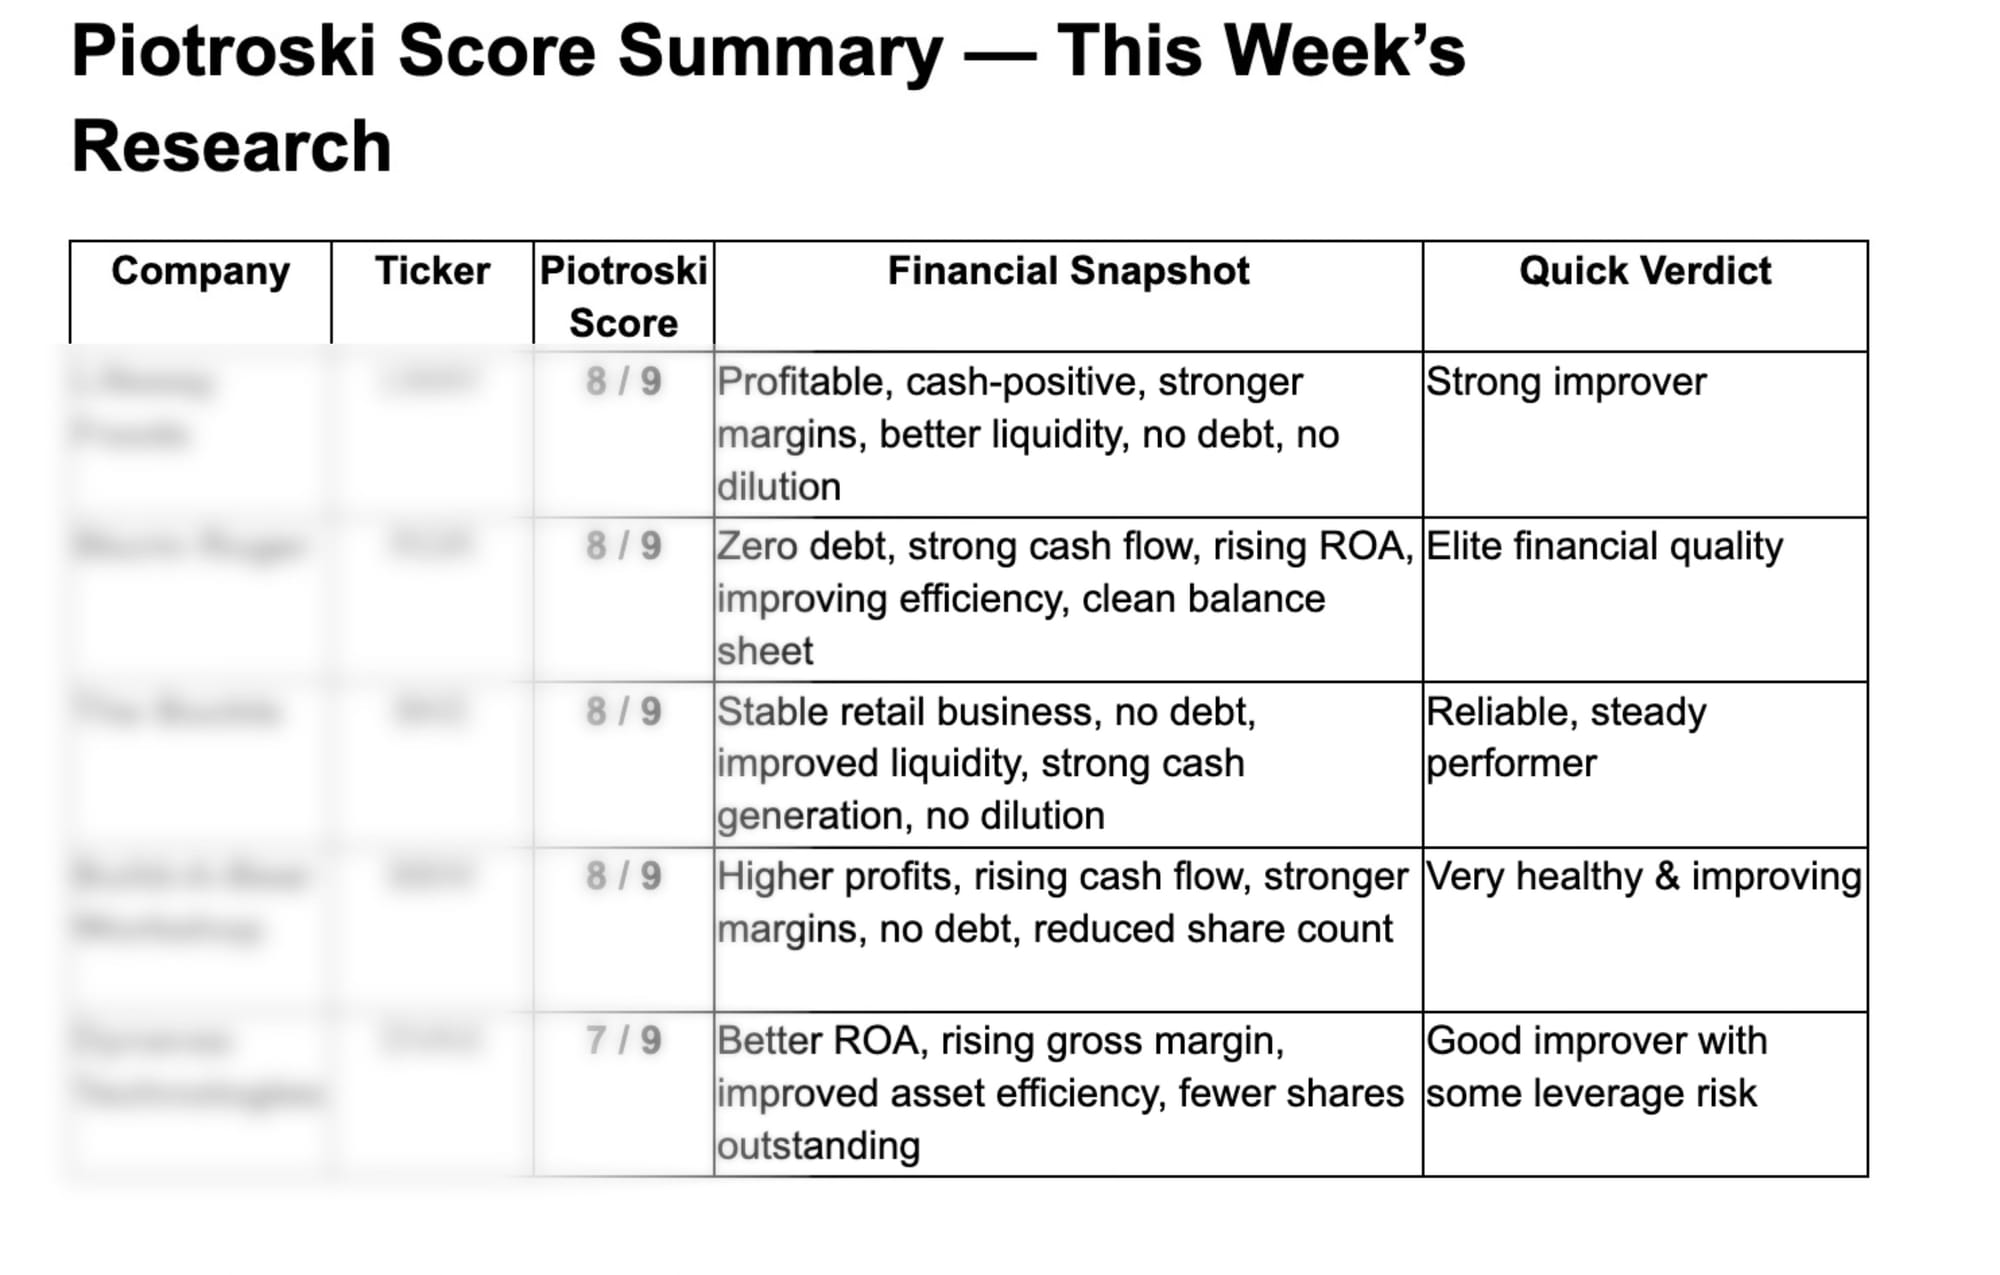
Piotroski Score Summary — This Week’s Research
Final Thoughts: A Simple Tool Worth Keeping in Your Toolkit
The Piotroski Score isn’t perfect. It focuses purely on accounting signals, so it can miss things like competitive threats, strategic investments, or industry shifts that don’t show up in the numbers yet.
Many analysts use modified versions. Some add revenue growth or free-cash-flow margin to capture economic strength. Others relax the “no dilution” rule or pair Piotroski with simple valuation checks like EV/EBIT to avoid expensive names.
But even with its limitations, the Piotroski Score does something valuable: It reveals which companies are getting financially healthier — and which are not.