Dec 23, 2025
How to Invest When Nobody Knows Anything
Three Rules for Thriving in a Market Full of Contradictions
Over the past year, you’ve probably felt like the markets are gas-lighting you. We've seen one false signal after another.
So let's catch up on what just happened, and then see if we can make better sense of it together.
The Forecast Whiplash of 2025
One week, Wall Street expects the Fed to cut rates aggressively. A few weeks later, we're told "Rate cuts may not come until 2026" (three actually came in 2025).
In January, analysts called the AI rally over — by March, they were urging investors to buy more.
Copper was “overheated” early in the year — then surged to record highs as supply tightened and China stepped in.
The dollar weakened on Fed-easing hopes — then rebounded on geopolitical stress and rising yields.
Every bold forecast is followed by another that confidently contradicts it, sometimes within the same quarter.
How are you supposed to make decisions when the experts can’t even agree with themselves for a month?
But the confusion we felt 2025 isn’t new.
It’s simply the newest chapter in a long pattern of confident forecasts colliding with unpredictable reality. Ironically, many predictions that gained the most attention were often the ones that turned out furthest from the truth.
Look at just a few examples from recent history:
A History of Spectacularly Wrong Predictions
1979 — “The Death of Equities”
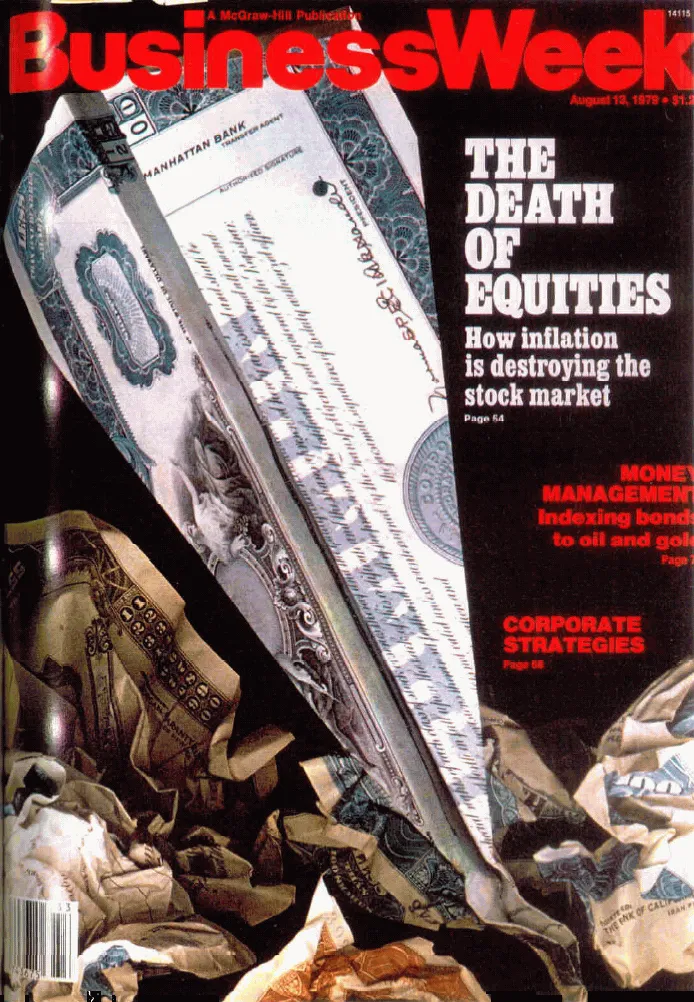
BusinessWeek declared that high inflation had effectively ended the ability of stocks to build long-term wealth.
What actually followed was a two-decade bull market beginning in 1982, with the S&P 500 increasing by approximately 28-fold in price, with total returns — including dividends — exceeding 7,000% — one of the strongest runs in history.
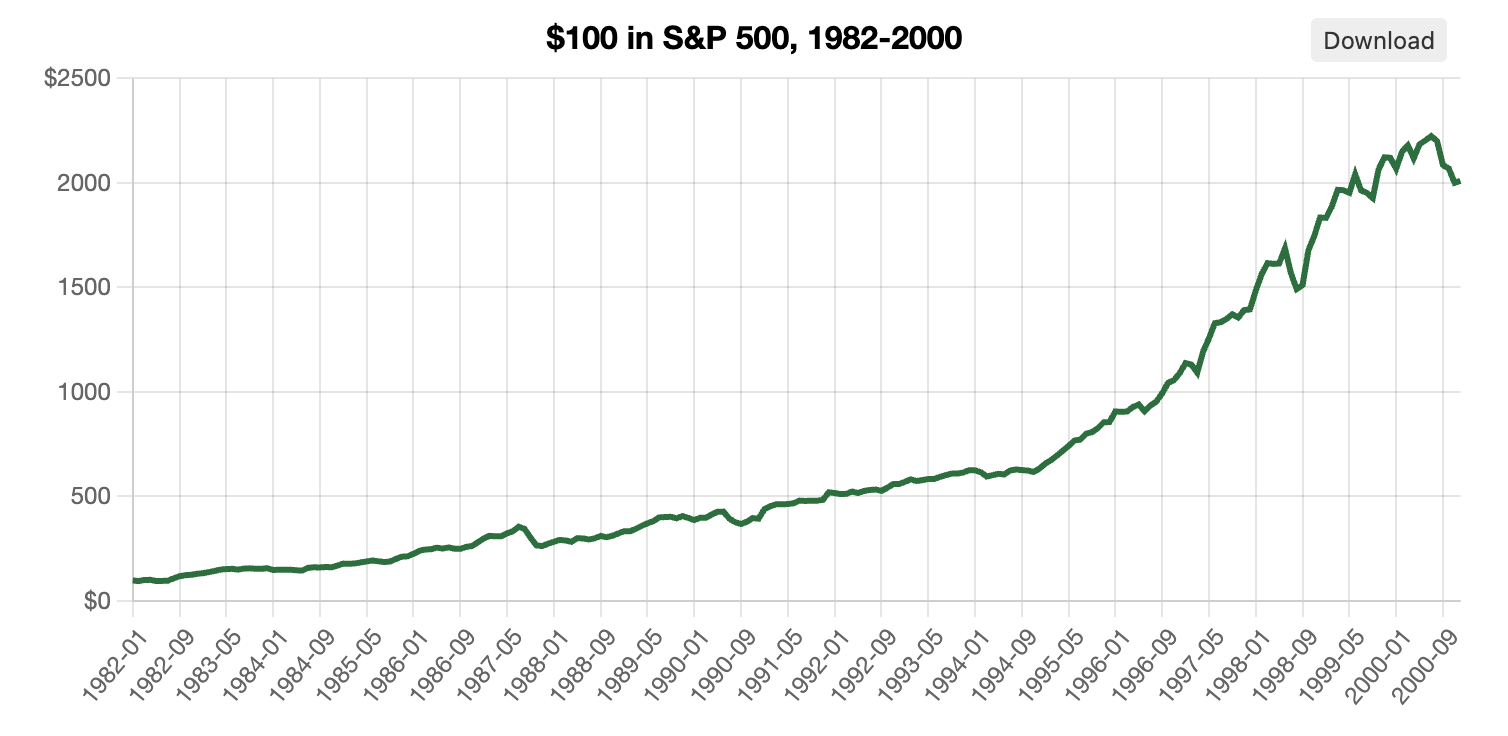
Data Source: https://www.officialdata.org
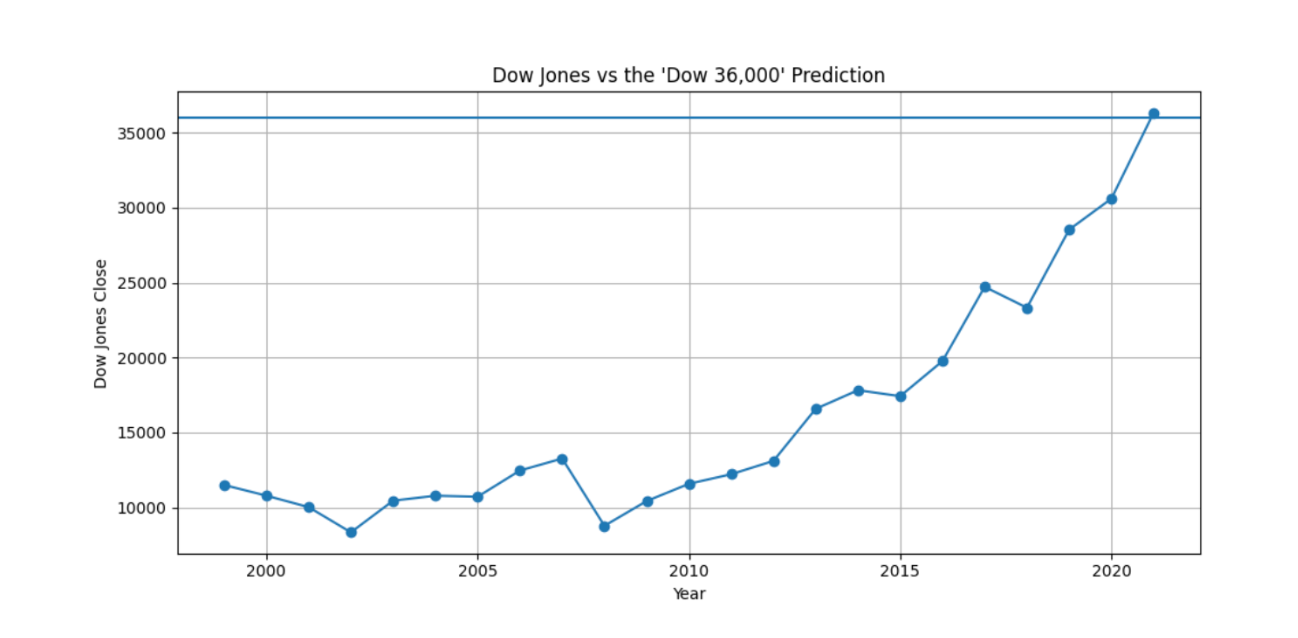
1999 — “Dow 36,000”
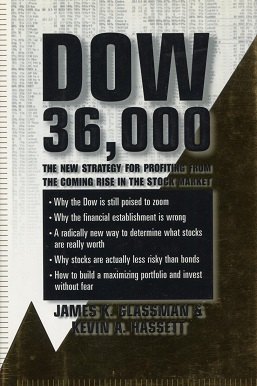
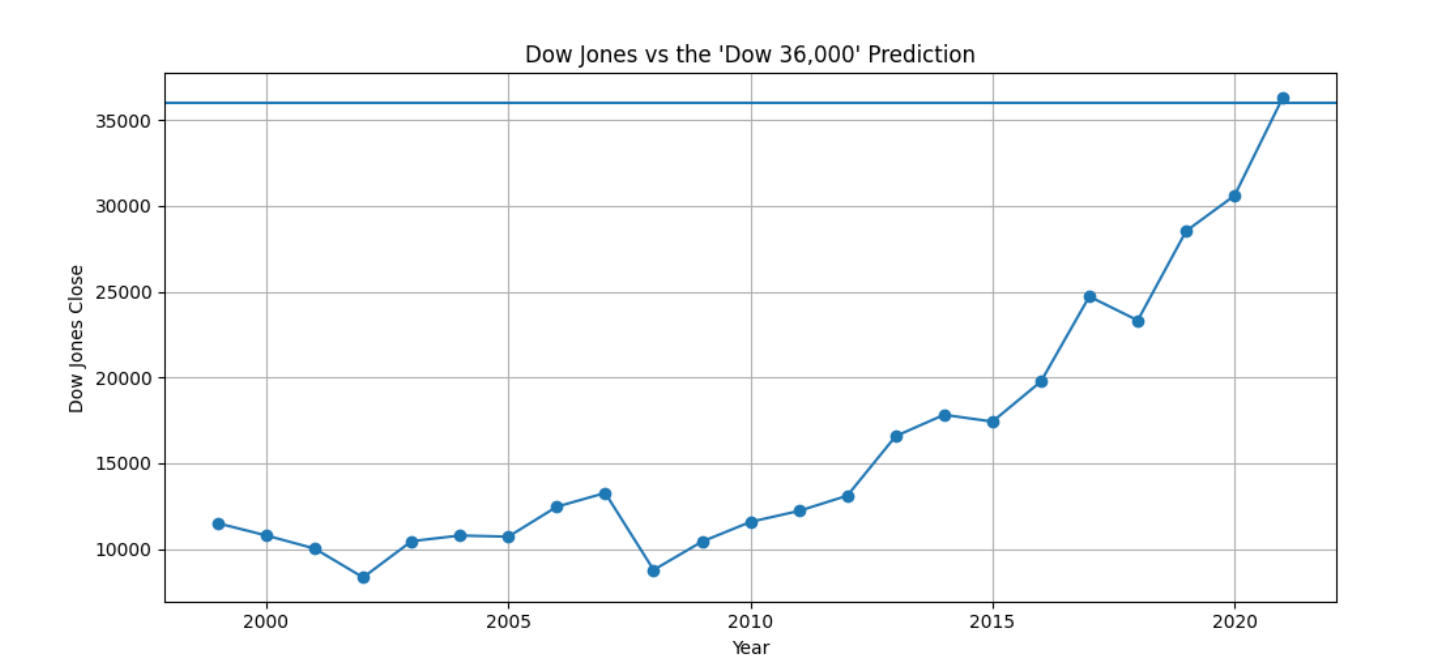
A book published during the dot-com boom argued that U.S. equities were dramatically undervalued and that the Dow would reach 36,000 by 2002–2004.
Instead, the dot-com crash began months later, and then the global financial crisis, and the COVID-19 pandemic. The Dow would not see 36,000 until 2021, more than 20 years later, and only after decades of monetary easing and structural changes to the economy.
One of the book’s co-authors later acknowledged that the core error was “assigning a timeline to a number.” Investors who followed the prediction without diversification could have waited decades for it to materialize.
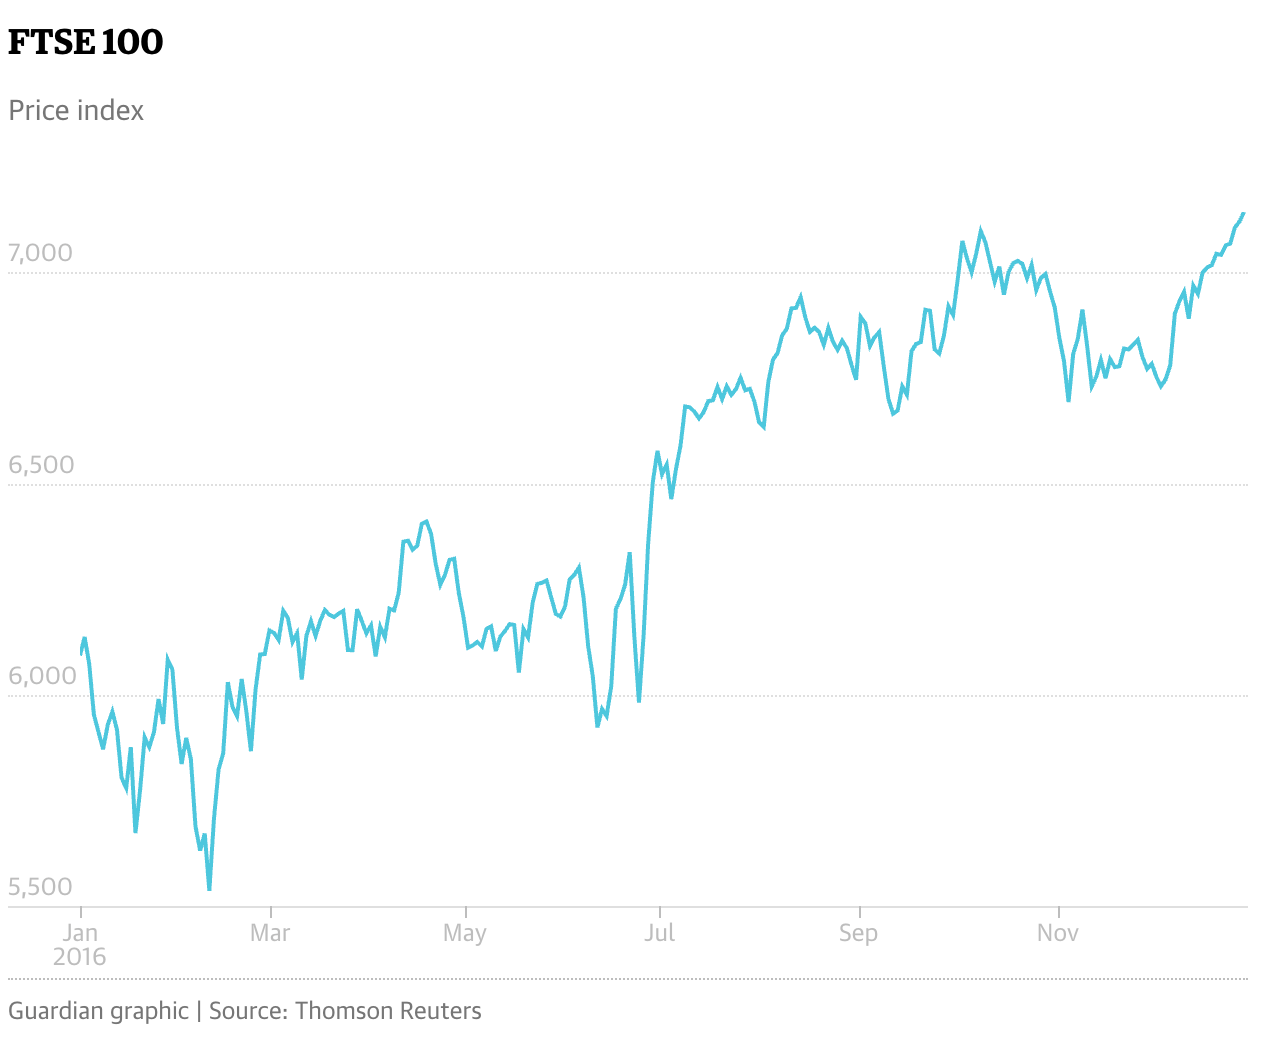
2016 — “Sell Everything”
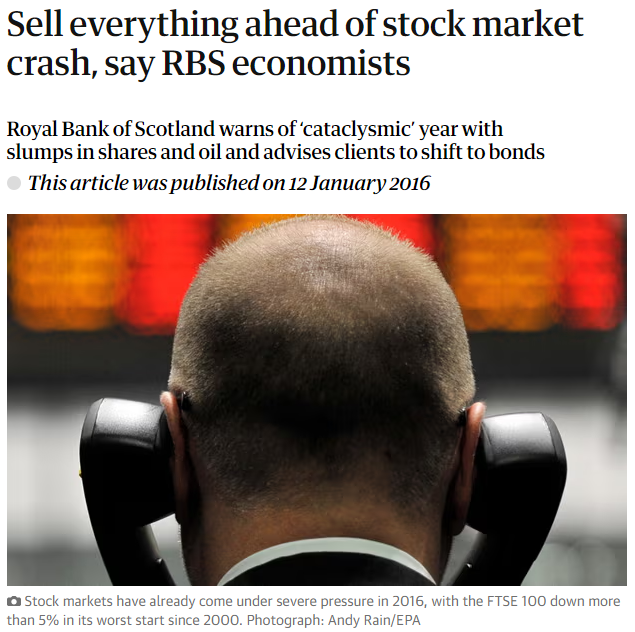
At the start of 2016, RBS advised clients to sell nearly all risk assets, warning that global markets were facing a potentially “cataclysmic” year and there will be a 20% drop in global stock markets and oil prices falling to $16 per barrel.
But in reality, nearly every major asset class rose that year: U.S. stocks gained over 10%.
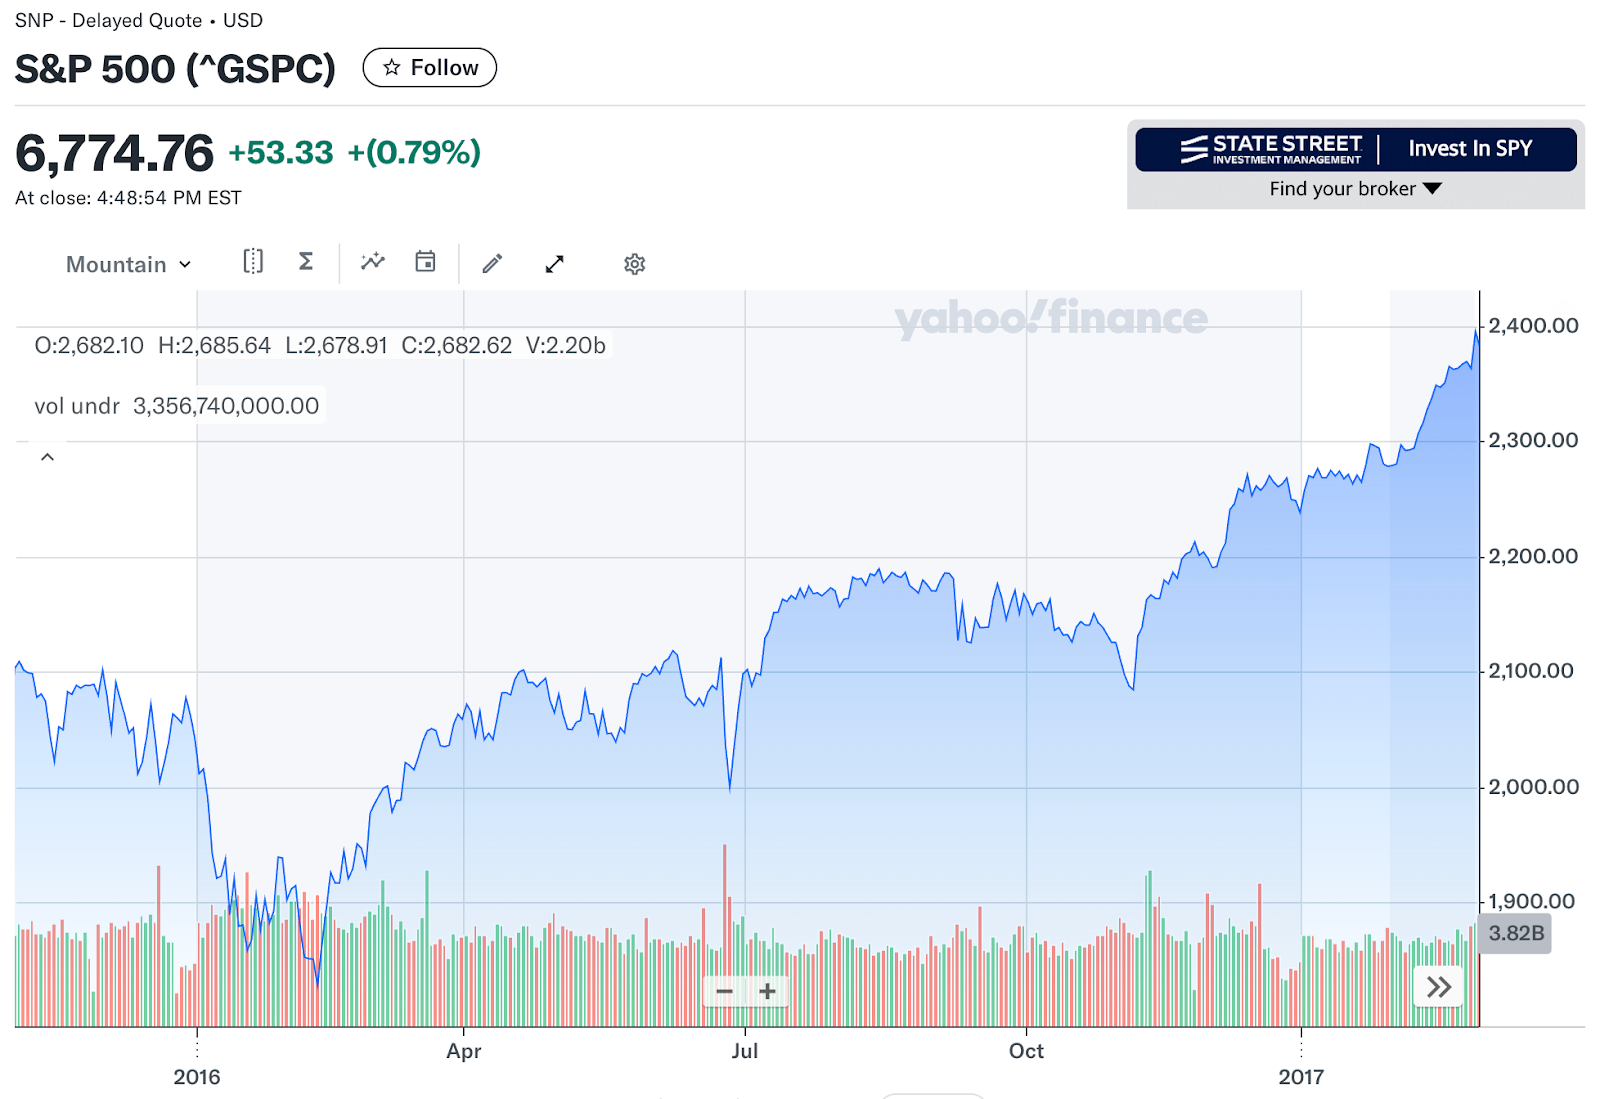
Oil rebounded, gold prices increased, emerging markets performed well, and the FTSE 100 even hit record highs after the Brexit shock.
2021 — Central Bankers Underestimated Inflation
Throughout 2021, major central banks described rising inflation as “transitory,” expecting it to ease without significant intervention.In reality, inflation accelerated sharply: U.S. inflation climbed above 9%.
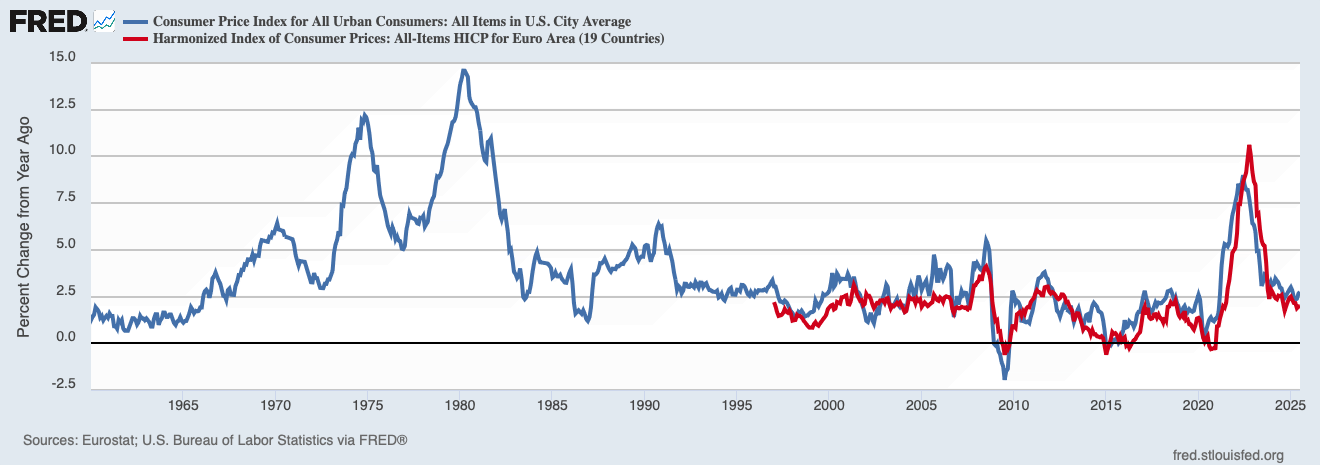
UK inflation reached 11.1% by late 2022, far above forecasts.
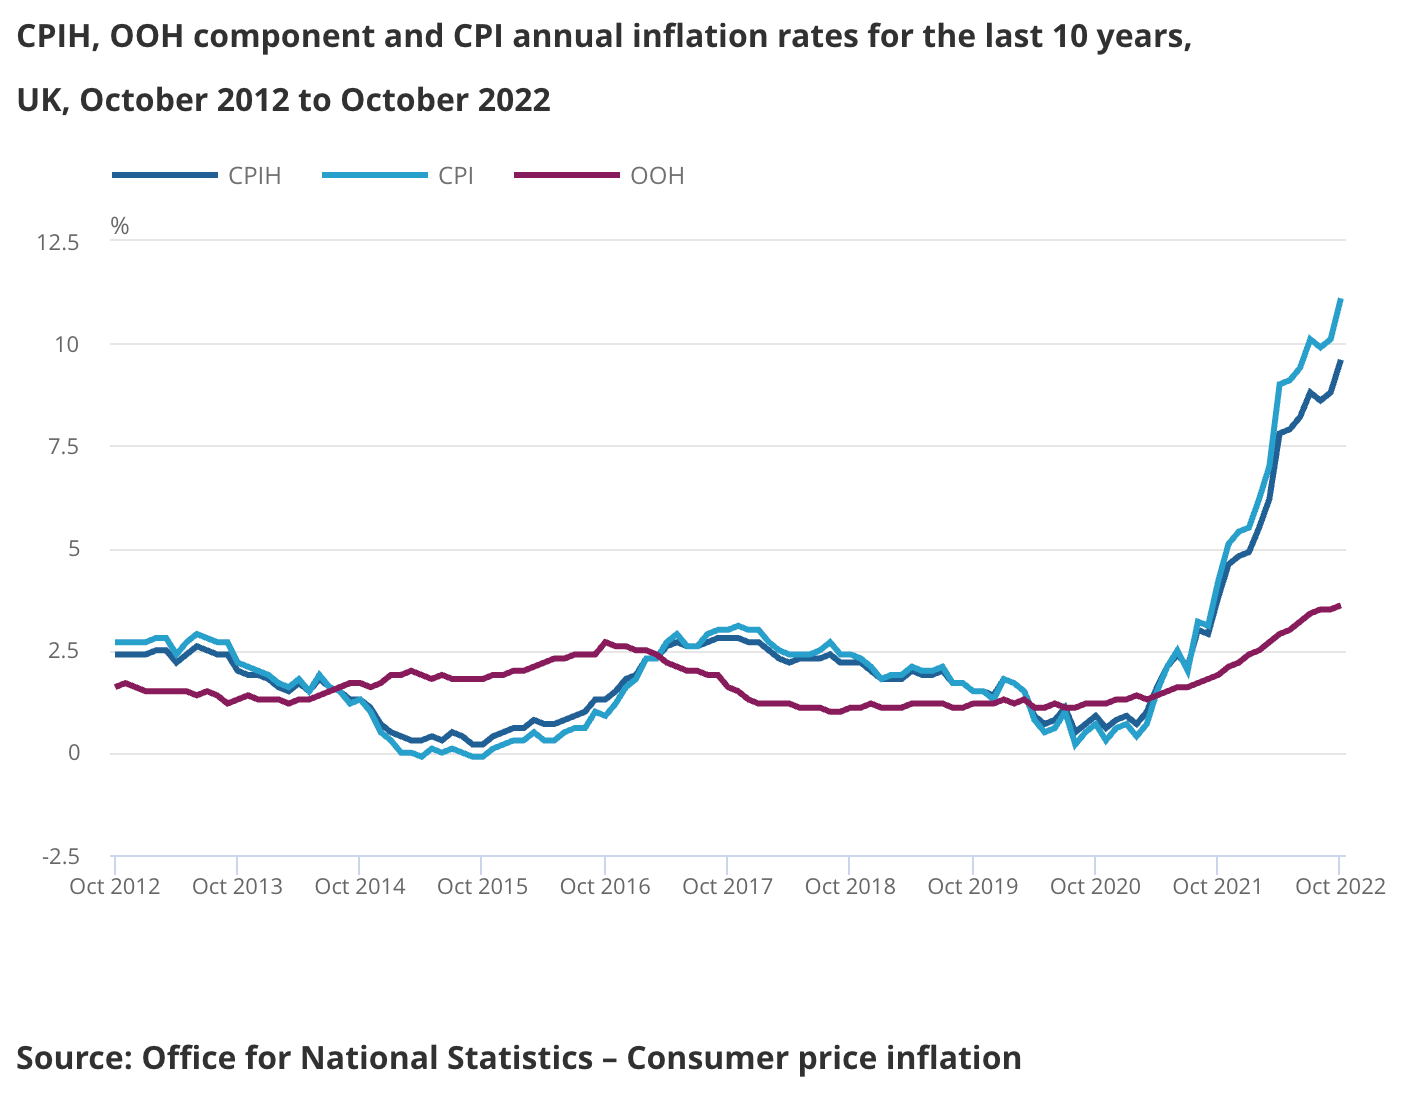
Central banks were forced into aggressive tightening cycles and later acknowledged their misjudgment.
Across all of these eras, the pattern is remarkably consistent:
The predictions were confident.They received enormous attention.The outcomes were entirely different from what was forecast.
Which brings us back to the real question:Not “Was the forecast right?” but: “What happens to your portfolio if it’s wrong?”
And one of the clearest reasons why? Just look at what happens when you try to time the market and miss its best days.
The Real Cost of Trying to Be Right
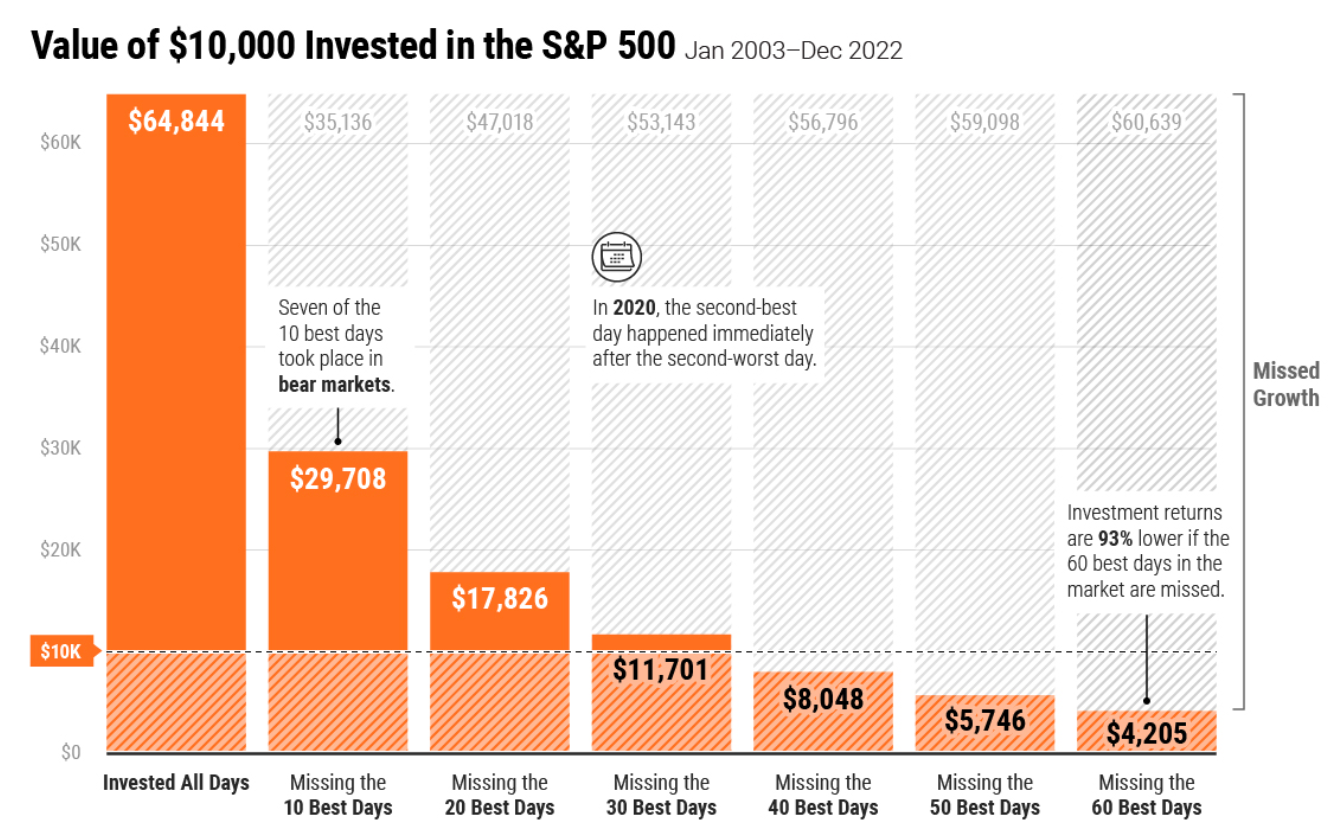
From 2004 to 2023, according to JP Morgan Asset Management, if you had simply stayed invested in the S&P 500, your average annual return would’ve been around 9.8%. But if you missed just the 10 best days, your return would’ve dropped to 5.6% — nearly cut in half. Miss the top 20 days, and your total return would be down by more than 70%.
Do you actually think you (or any “expert”) can predict the market’s best or worst days?
Even more telling: 6 of the 7 best-performing days over those 20 years happened within just two weeks of one of the 10 worst days. In other words, the biggest rebound days often come right after the biggest drops — exactly when most people are pulling out.
Trying to avoid losses often means missing the recovery.
Over time, investors who stay invested and ignore the noise tend to outperform those who try to jump in and out.
As Ken Fisher is believed to have said, it’s not about timing the market. It’s about time in the market.
Which brings us to the better question — not “What’s the next forecast?” But: “What kind of investing process can I actually rely on?”
Start with these three rules.
Rule 1: Focus on What Can Actually Be Predicted
You can’t predict next quarter’s inflation or rate moves. But you can build around what has worked for decades.
Start with this: since 1928, the S&P 500 has returned about 10% per year on average (6–7% after inflation), even through crises like the dot-com bust and 2008 crash. Over the past 20 and 30 years, annualized returns have remained remarkably stable at ~9.7% and ~10.5%, respectively. That long-term trend is far more reliable than short-term predictions.
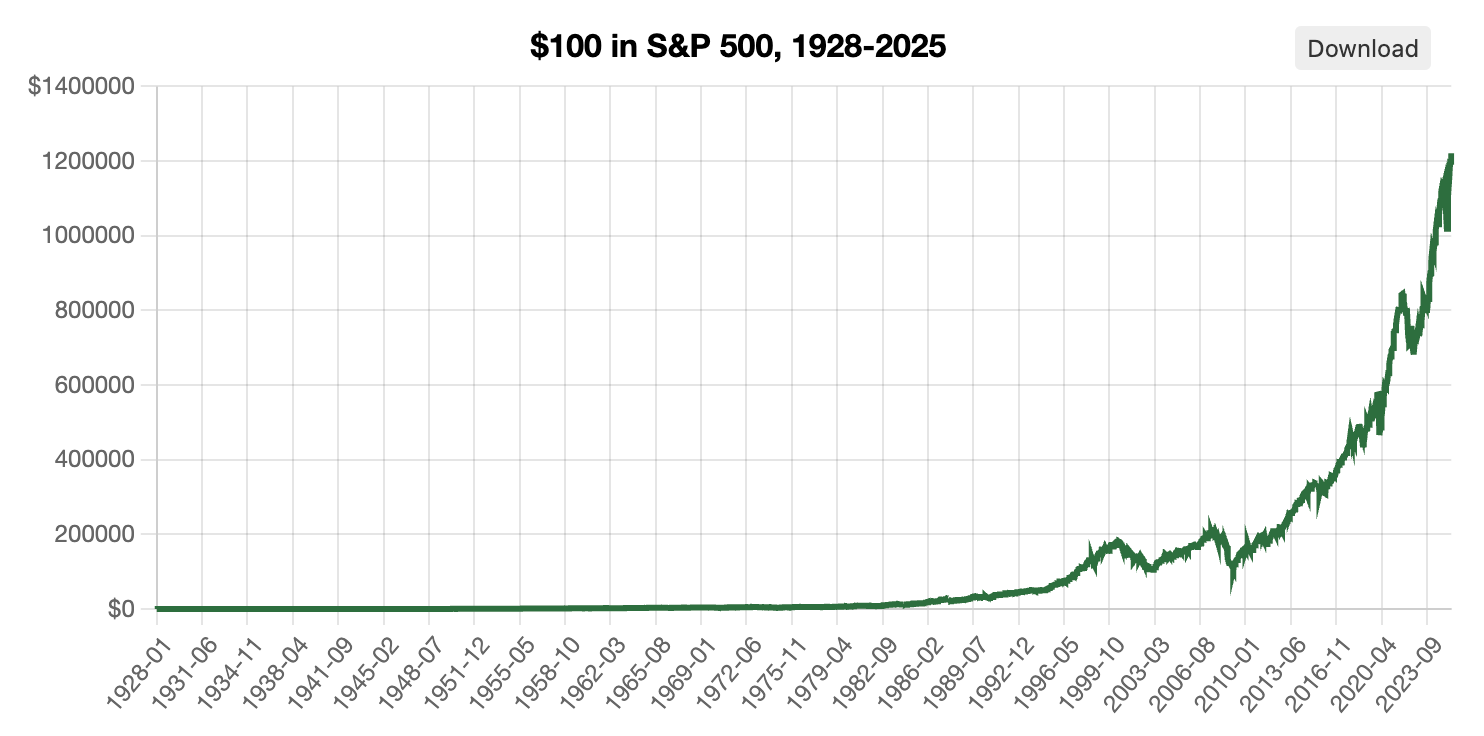
Data Source: https://www.officialdata.org
Another “safe” finding based on nearly a century of data:
Value stocks (those with lower price-to-book or earnings ratios) have outperformed growth stocks by roughly 4.4% per year since 1927. As we’ve seen lately, there can be multi-year periods when this doesn’t happen – investing will always be a somewhat unpredictable social science – but it tends to be true more often than not.
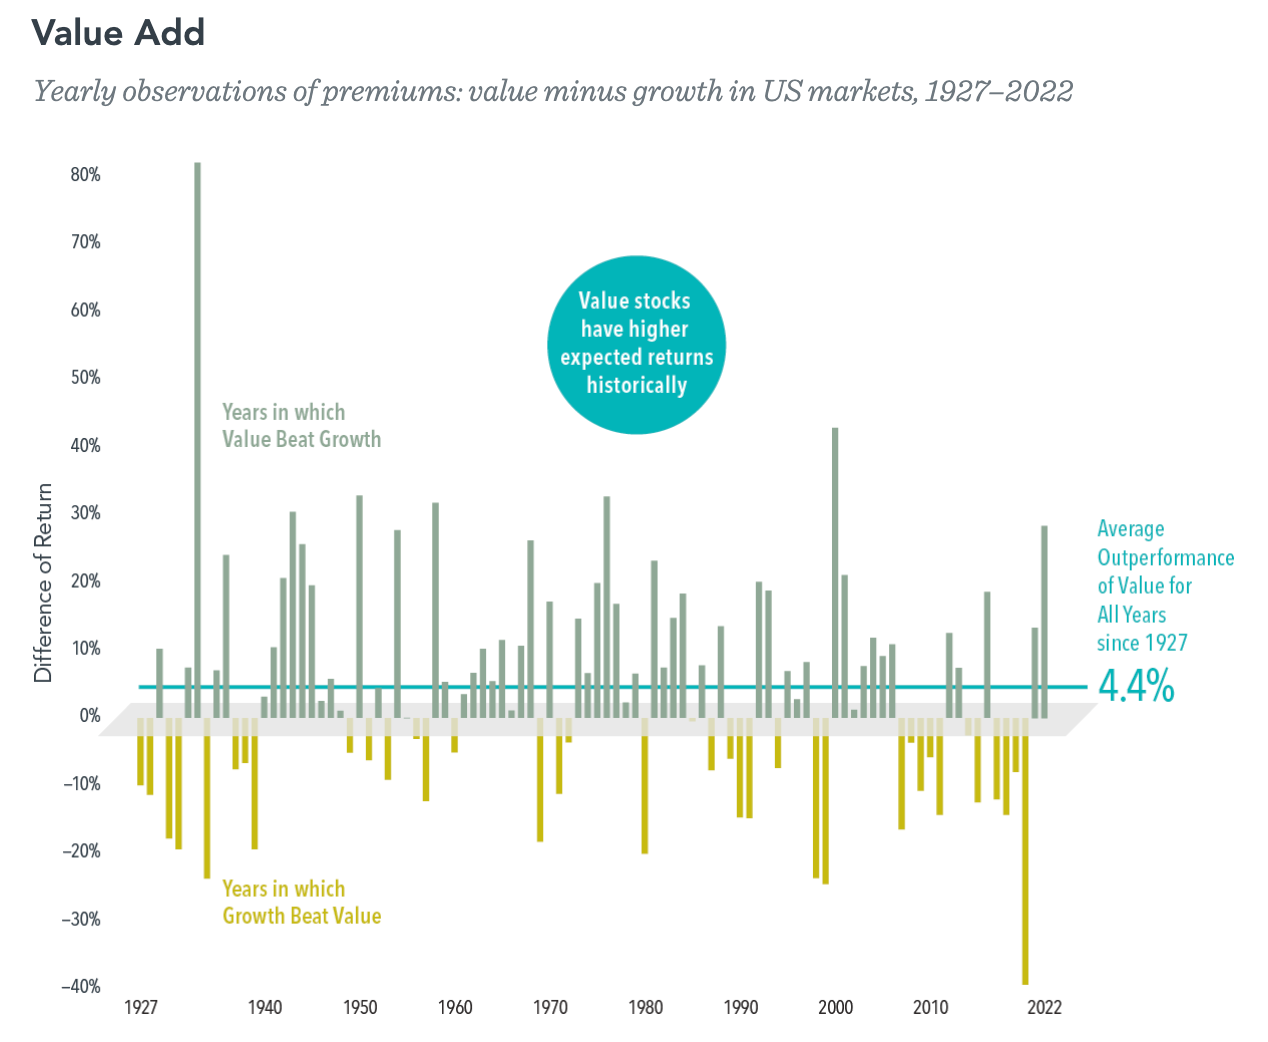
Source: https://www.dimensional.com
High-quality companies — profitable, low-debt, stable — have outperformed the market in every 10-year rolling period since 1998, and beaten growth stocks in about 85% of those periods.
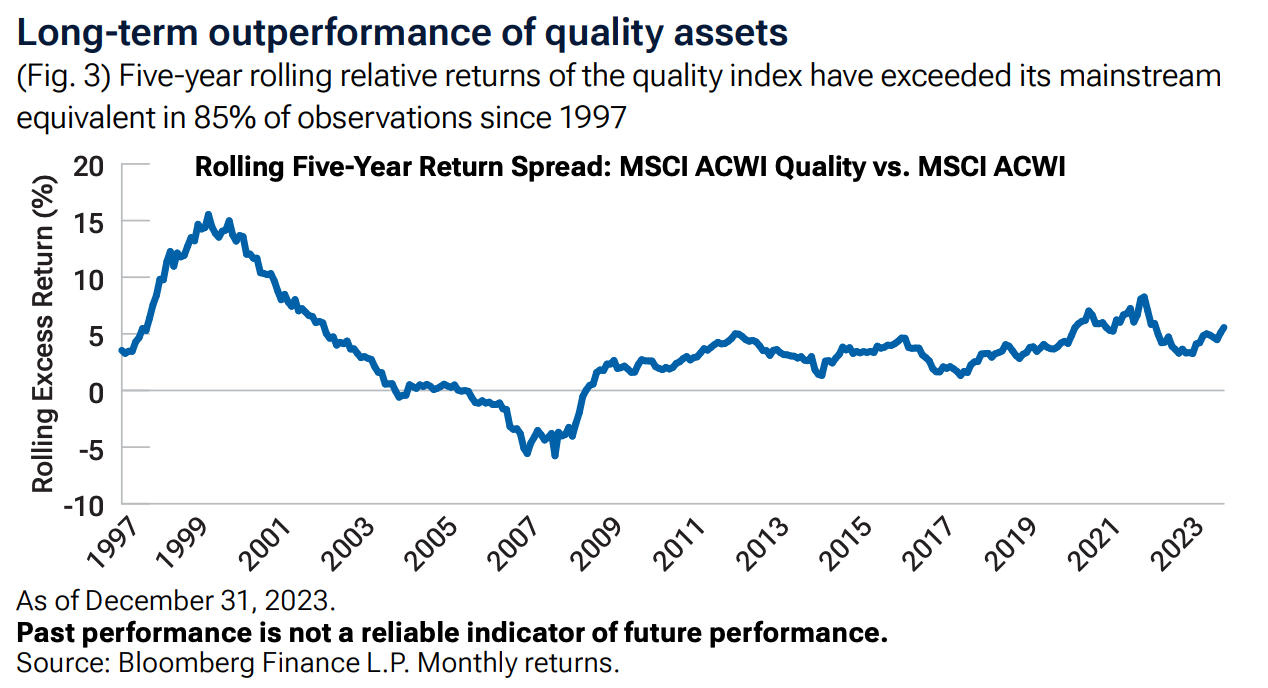
Source: Bloomberg
Dividend-paying stocks have also delivered strong results: from 1960 to 2023, $10,000 invested in the S&P 500 grew to over $6.39 million when dividends were reinvested — compared to just $982,000 without dividends.
That’s more than a sixfold difference, showing how compounding income, not just price appreciation, drives long-term wealth.
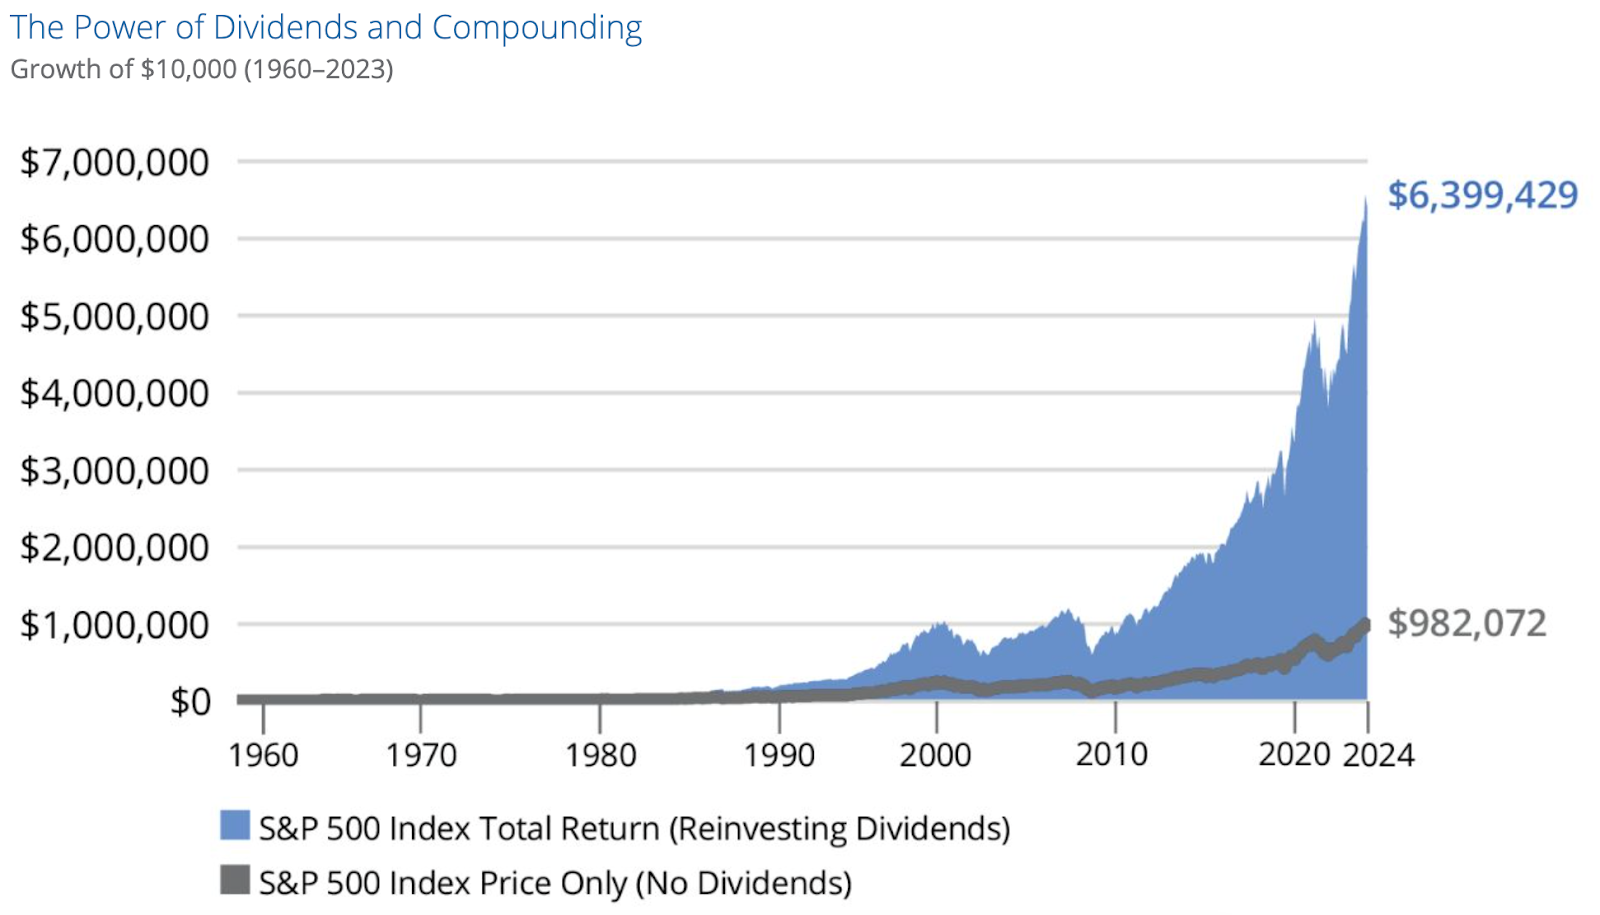
Source: https://www.hartfordfunds.com
Large-cap stocks like those in the S&P 500 have not only earned ~10% long-term but finished positive in ~70% of years — compounding reliably above inflation.
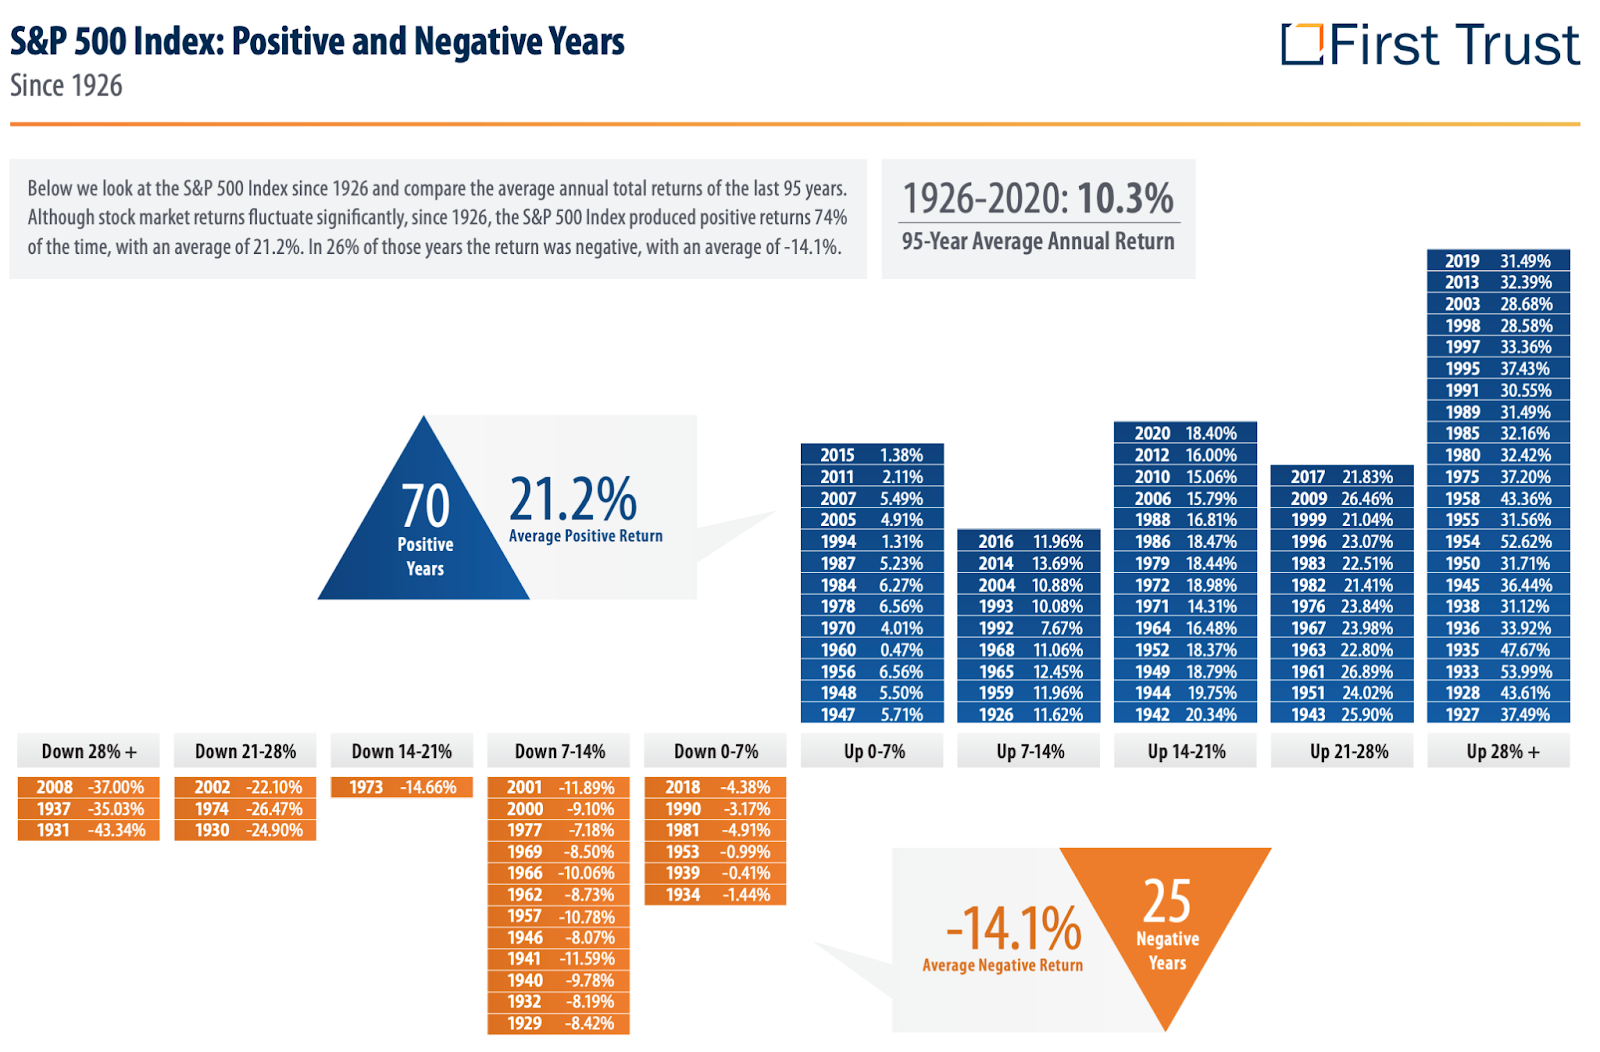
Source: www.ftportfolios.com
None of these factors win every year. But over time, they’ve rewarded investors who stayed the course.
Unless you have a proven edge, why stray from what works?
I can’t tell you how to invest. But a line of thinking that should work for many long-term investors would be this: Start with index funds. Tilt toward factors like value, quality, or dividends if they align with your goals. But don’t build your strategy around this year’s narrative — build it around what’s stood the test of time.
Rule 2: Build a System That Doesn’t Need to Be Right
Forecasts come and go. A good portfolio doesn’t rely on any single one being right — it’s designed to work even when they’re wrong.
Here’s what that looks like:
- Start with goals and time horizons. Build around what you need, not the latest hot prediction.
- Use asset allocation to match reality. Historical data from 1926 to 2019 shows that portfolios with higher stock allocations deliver higher average returns — up to 10.3% annually for 100% stocks — but also experience much steeper drawdowns, with worst-year losses reaching -43.1%. More balanced portfolios, like 60/40 or 50/50, offered solid long-term returns (8.8% and 8.3%, respectively) while cutting worst-case losses nearly in half.
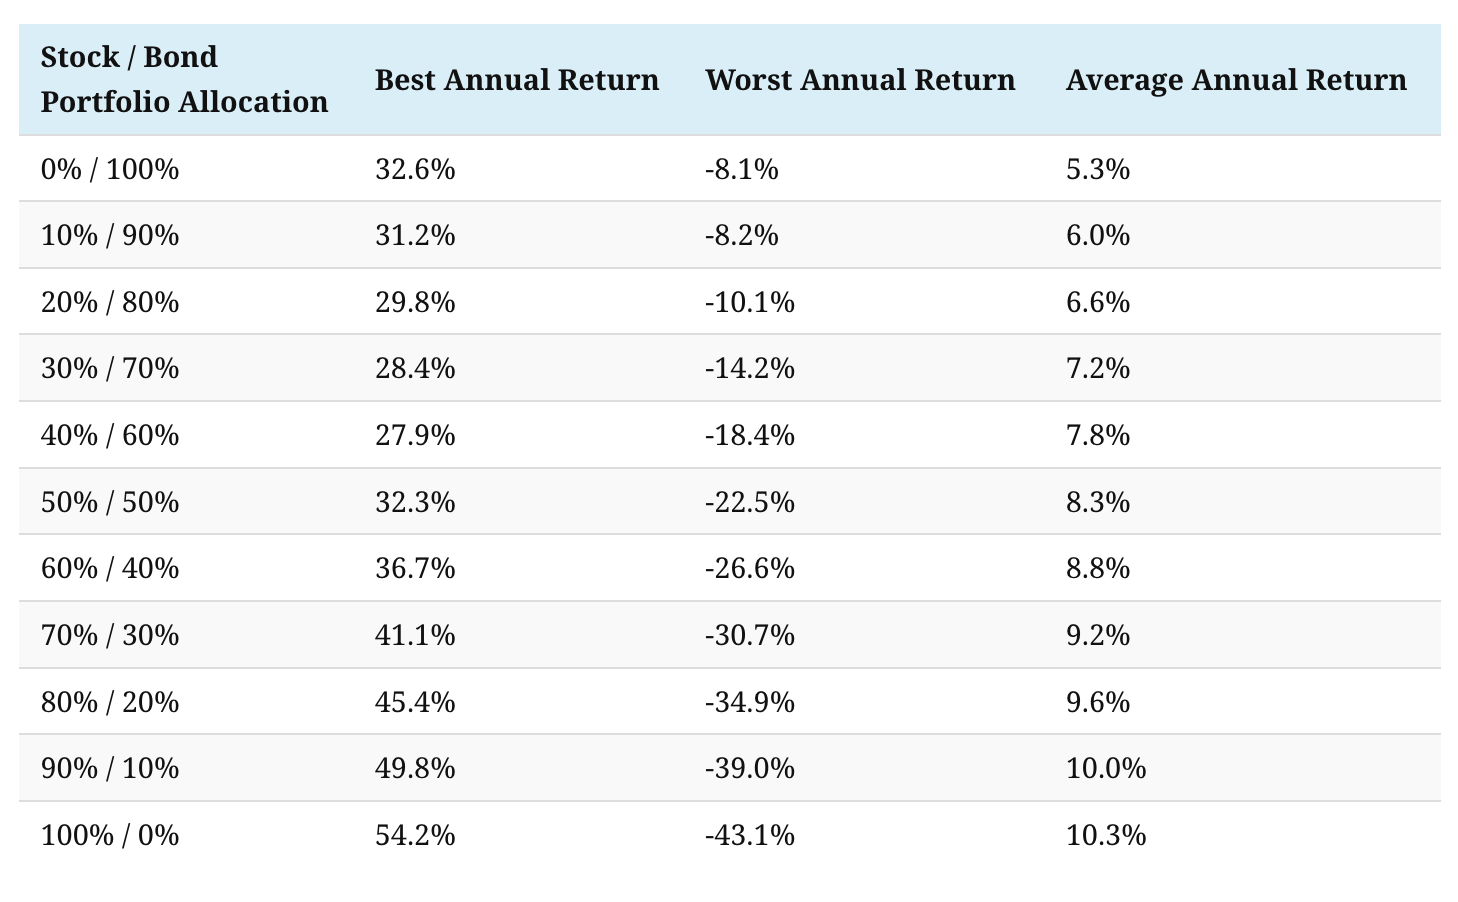
Source: https://advisor.visualcapitalist.com
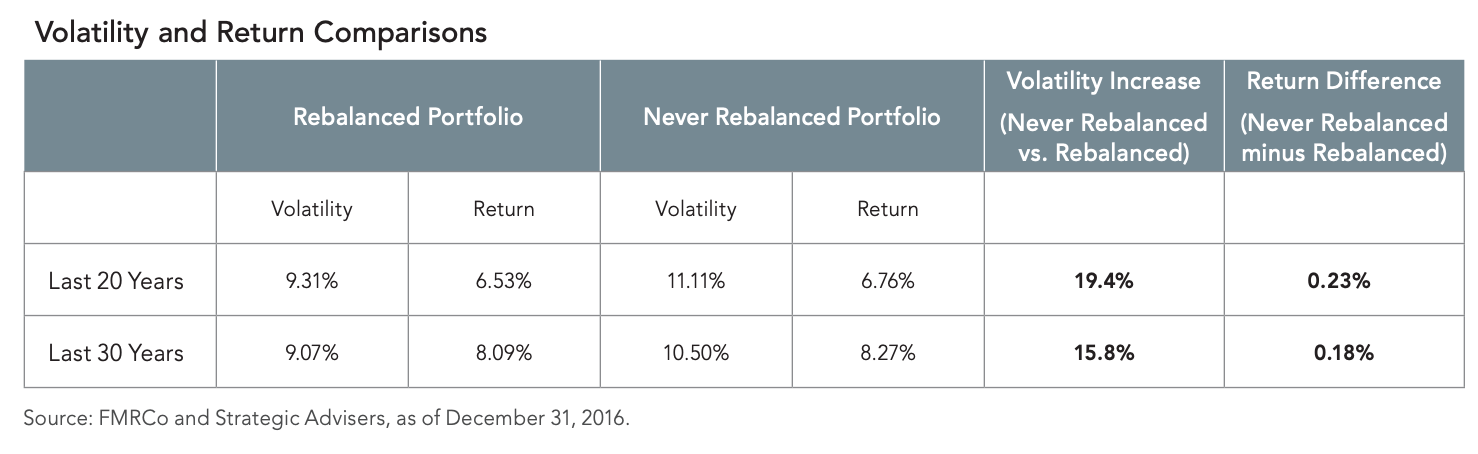
- Rebalance regularly. Over the past 20–30 years, rebalanced portfolios delivered nearly the same returns as untouched ones — but with 16–19% lower volatility. It’s a simple, disciplined way to reduce risk without giving up performance.
- Stay in the game. Markets often deliver their biggest gains right after their worst days. Missing the 10 best-performing months in 30 years would cut your wealth by two-thirds; missing the top 20 days over 20 years would erase all your gains.
Source: https://www.visualcapitalist.com
In investing, staying invested beats being clever. A sound system helps you stay standing when others panic.
Rule 3: Don’t Mistake Financial Entertainment for Strategy
The truth is, most market forecasts — even the ones on finance TV or in blue-chip research reports — are not tools.
They’re content. They’re built to engage your attention, not build your wealth.
They satisfy the part of our brain that wants certainty in an uncertain world. But they belong in the same category as horoscopes and tarot cards: fun, sometimes insightful, but not to be acted on.
You don’t need to know what copper or the dollar will do next to be a good investor. You need a process you can stick with — especially when the noise gets loud. Ambiguity may be a source of stress, but it’s also a source of profit.
The market rewards patience and uncertainty tolerance — not forecasting prowess.
The Only Edge That Lasts
If there were a clean formula for investing, there’d be no opportunity. If someone could tell you what to do with perfect clarity, the edge would vanish.
But here’s what we do know:
Don’t anchor your plan to this quarter’s prediction.
Do anchor it to your life, your timeline, and your ability to endure discomfort.
No market tendency applies equally at all times, but some market tendencies have stood the test of time better than others.
In the long run, the investors who succeed aren’t the ones who predict the most.
More likely, they’re the investors who predict the least.