Jan 29, 2026
America’s Balance Sheet: What Every Investor Should Know Heading into 2026
Federal debt now exceeds $38 trillion — more than $200,000 per taxpayer.
According to the CBO, the next decade will add another $20 trillion.
That math matters.
Recent dialogue about the U.S. economy has focused on the Federal Reserve, inflation, the labor market, and the “Magnificent Seven.” While these topics dominate headlines, they overlook the elephant in the room that will shape markets over the next decade: the balance sheet of the United States government.
Every market era has had a defining force.In the 1990s, it was tech-driven productivity.In the 2000s, globalization.In the 2010s, ultra-low interest rates.
Today, the central force is different. It is the overleveraged balance sheet of the U.S. government.
Debt levels are reaching historic highs, interest costs are rising faster than tax revenues, and financial markets are priced for near-perfect economic outcomes.
High government spending, in conjunction with loose central bank policy both inside and outside the US – broadly in effect until the past few years – has created a high-liquidity environment that’s had a bifurcated effect:
- While not quite an “everything bubble,” an environment where meme stocks and other risk-on investments trade at all-time highs.
- A market where gold and similar risk-off investments also trade at all-time highs.
Weird economic conditions are afoot.
Adding a time dimension, the US Treasury yield curve tells this story in microcosm: Investors are willing to pay up for US government debt maturing out through the next, say, five to seven years; arguably even 10. But they’re far more afraid to own 20-year and 30-year US debt.

If this sounds wonky, don’t worry: I’ll walk through how the US government’s financial position has gotten to the point that many worry that we may be partying in the present at the expense of a hangover in the future – and what this means for investors like you.
How US Borrowing has Changed
The United States is not just borrowing more than ever: the cost of servicing that debt is rising rapidly.
Since 2021, the weighted-average interest rate on U.S. debt has increased by nearly two percentage points, making interest payments one of the fastest-growing federal expenses. Debt is no longer “cheap.” It now compounds.
This shift has altered the structure of the U.S. economy. Today, federal, state, and local government spending accounts for roughly 40% of GDP.
At these levels, government spending acts as a powerful economic lever. When it expands, it supports demand. When it stabilizes or slows, it becomes a meaningful drag on growth.
In FY 2025, the total US government tax receipts totaled an estimated $5.2 trillion while the US government spent a total of $7 trillion, creating an estimated deficit of $1.8 trillion for the US government in 2025. This deficit will continue to grow as the US debt compounds, creating an ever-increasing gap between the money received and the money spent by the US government. This gap between government spending and revenue must be financed through the issuance of more debt. And more debt can create a vicious circle.
First, as supply (of debt) increases relative to demand, prices of both new and existing government bonds tend to fall.
Because bonds pay fixed payments, as market prices of existing bonds fall, their yields rise, raising the bar for newly issued bonds (which must pay higher yields, too, to compete with existing bonds). In simple English, as market rates rise, bond issuers – including the US government – receive less money and pay out more in interest.
Second, the increased price of debt will create greater interest expense in the federal budget and will widen the yearly deficit that the United States government will face. This will lead to greater future borrowing under higher rates, creating higher interest costs and greater debt for the US government.
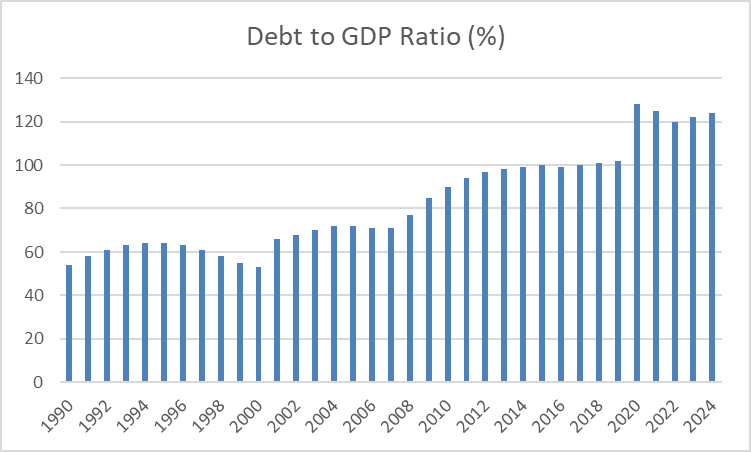
What makes this cycle materially different from past periods is the starting point. In the early 1990s, US federal debt stood near 60% of GDP and declined through the end of the decade. Today, federal debt exceeds 120% of GDP — a level reached only twice in US history, and only under extraordinary circumstances.
At these levels, debt accumulation is no longer a background variable. Each incremental rise in interest rates meaningfully increases the government’s financing burden, reinforcing persistent deficits and reducing fiscal flexibility. The economy has shifted from a regime where debt was manageable to one where debt dynamics actively shape growth, policy, and market outcomes
As risk-free borrowing costs rise, essentially all US assets must deliver higher returns to justify the same level of investment. When they do not, capital reallocates.
What This Means for Investors
As government debt grows, markets begin to price in a higher and less predictable path for future interest rates, pushing long-term Treasury yields higher. Since these yields anchor discount rates across financial markets, the effects extend well beyond bonds. Equity valuations compress, long-duration assets face greater pressure, and capital becomes more expensive throughout the economy.
Bonds
Rising discount rates will lead to marginal diversification away from US assets, as new capital becomes more selective across countries and currencies.
In the bond market, this shift makes demand for US Treasuries more price sensitive. As issuance rises and fiscal uncertainty grows, investors increasingly require higher yields to absorb supply—particularly at longer maturities.
The result is wider term premiums, stronger demand for short-duration bonds, and structurally weaker demand for long-duration US debt.
US Equities
The same forces reshaping the bond market will also impact the US equities market. Higher and more volatile risk-free rates will raise discount rates across financial markets, which in turn will compress equity valuations and increase the cost of capital for businesses.
In the past when rates were low, equity markets rewarded companies whose value depended heavily on long-term projected cash flows.This dynamic is changing. Now that rates are increasing, long duration equities are much more vulnerable to rate movements. This has shifted the equity market to where near-term cash generation and balance sheet strength regain importance.
This shift is important to keep in mind considering much of the equity growth over the last few years is derived from companies with high levels of debt with minimal short term earning potential. Many of the companies in the tech sector and part of the “Mag 7” fall into this category.
As government borrowing rises, higher risk-free yields compete more directly with equities for capital, raising the return investors require from the market as a whole. Growth can continue in this environment, but index-level valuations become more sensitive to shifts in interest rates and fiscal policy as returns must clear a higher hurdle.
Alternatives Investments
As traditional assets face higher discount rates and greater sensitivity to policy, investors are increasingly compelled to look beyond bonds and equities. One of the main beneficiaries of this diversification will be hard assets such as precious metals. Hard assets tend to perform better in fiscally constrained environments because they cannot be diluted by issuance and do not depend on government policy to drive growth.
Beyond precious metals, real assets and infrastructure will be popular investments going forward. Assets tied to physical utility, such as energy infrastructure, transportation networks, utilities, and data infrastructure should be popular investments. These investments often generate long term consistent cash flows that are less sensitive to interest rate volatility, making them semi-substitutes for long duration fixed income.
There are many other creative ways investors will look to diversify but the common theme across these allocations is risk control.
Beneficiaries of Diversification
As investment, at the margin, becomes less concentrated in the United States, winners will emerge globally. Countries that have stable balance sheets with less reliance on continuous debt issuance will become more attractive destinations for global capital.
In addition to countries with low debt on their balance sheet, export-oriented economies and commodity producing nations will also benefit from the shift away from US investment. When global capital reallocates away from consumption-driven, debt financed growth, as seen within the US, it often flows toward countries tied to industrial production, energy, and resource development.
As capital becomes less concentrated inside the US, companies will begin to reassess where they choose to list shares for their company. Because US equity markets now demand stronger near-term cash flows, many companies — particularly those in capital-intensive growth phases — may increasingly choose to list outside the United States. Over time, this shift could redirect a greater share of global equity issuance toward markets with lower discount rates and longer-term investor horizons.
This does not signal the end of US equity markets, which will likely remain the world’s preeminent destination for capital formation. Instead, it implies that incremental growth in global equity listings may shift toward other markets as capital, valuations, and policy regimes diverge.